
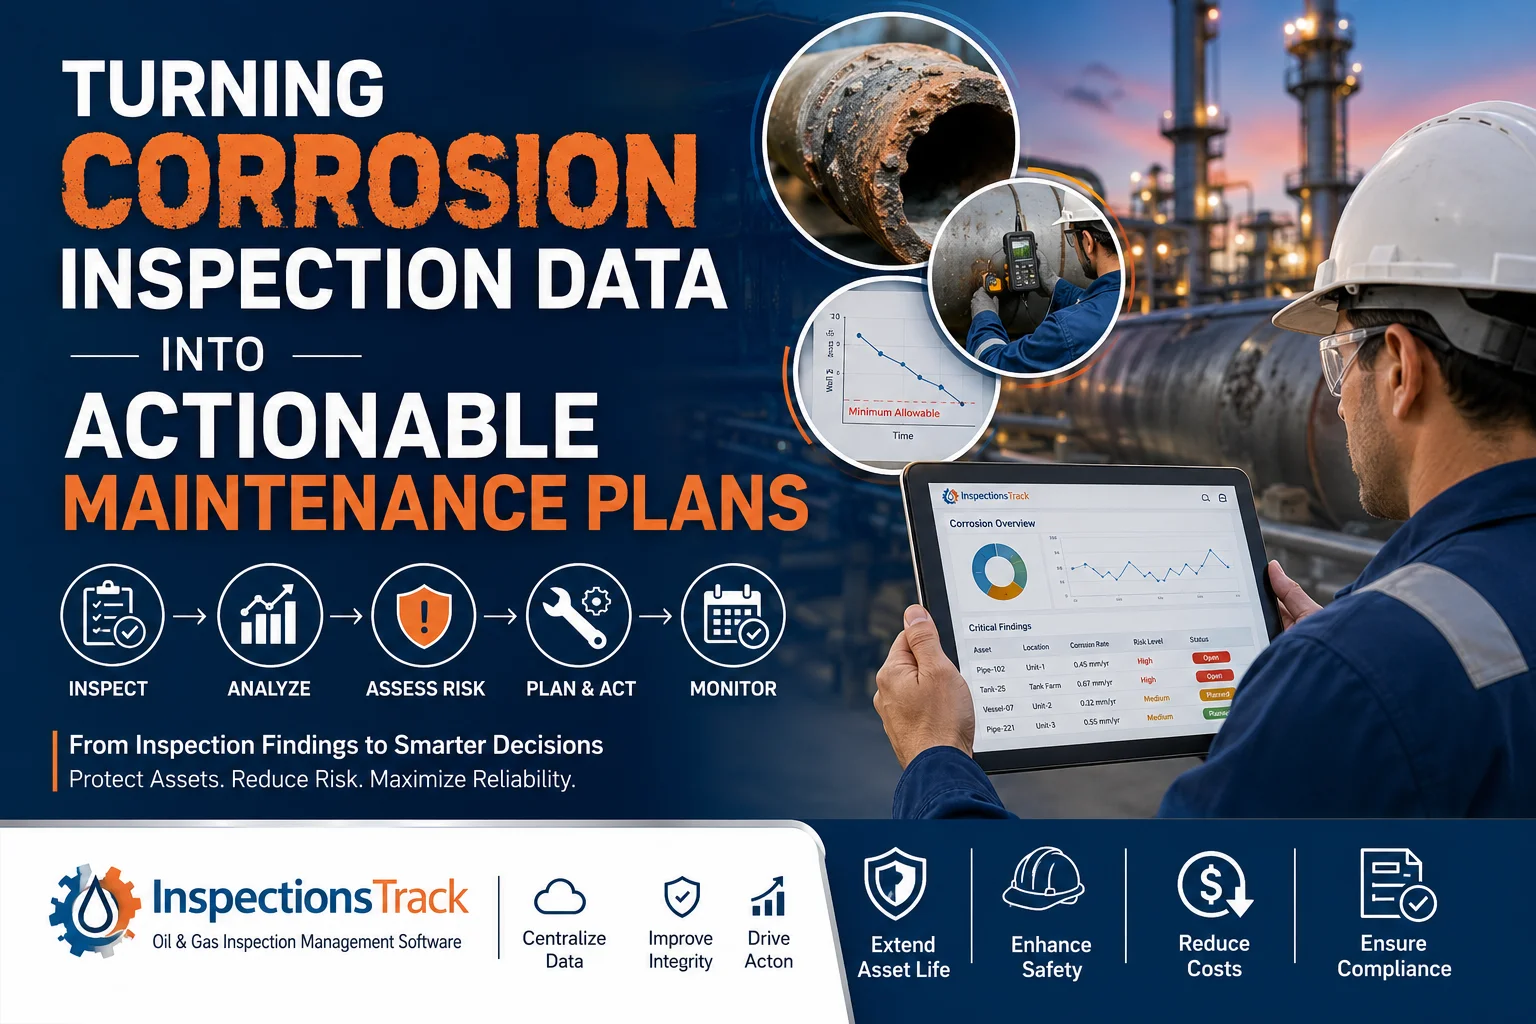
Corrosion is one of the most persistent threats to equipment, pipelines, storage tanks, offshore assets, and other critical infrastructure in the oil and gas industry. However, collecting corrosion inspection data is only the first step.
The real value comes from turning that inspection data into actionable maintenance plans that help teams identify risks, prioritize repairs, schedule preventive maintenance, and protect asset integrity.
For many inspection teams, the challenge is not a lack of data. Instead, it is the difficulty of connecting inspection findings with maintenance decisions.
Inspection reports may contain corrosion rates, thickness measurements, photographs, defect locations, inspection dates, asset details, and recommendations. Yet, when this information is stored across spreadsheets, PDFs, emails, and disconnected systems, it becomes difficult to determine what needs attention first.
A modern corrosion inspection management system can help bridge this gap by connecting inspection data, asset information, risk assessments, maintenance activities, and reporting in one workflow.
In this article, we will explore how oil and gas companies can turn corrosion inspection data into practical maintenance plans and how inspection software such as InspectionsTrack can support this process.
Corrosion inspection data is information collected during inspections to evaluate the condition and integrity of equipment and assets.
Depending on the asset and inspection method, this data can include:
This information provides a snapshot of an asset’s current condition.
However, inspection data becomes significantly more valuable when it is compared with historical results and connected to maintenance decisions.
Many oil and gas companies already collect large volumes of inspection data. The problem is often how that information is managed after the inspection is completed.
For example, an inspector may identify significant wall thinning on a pipeline section. The finding might be documented in an inspection report. However, if the recommendation remains inside a PDF or spreadsheet, the maintenance team may have to manually identify the issue, create a work order, assign responsibility, and monitor completion.
This creates several risks.
Large inspection reports can contain hundreds of observations. As a result, critical corrosion findings may not receive immediate attention.
Corrosion is a time-dependent problem. Therefore, knowing the current thickness is useful, but understanding how quickly thickness is changing can be even more important.
When inspection data and maintenance information are disconnected, teams may spend unnecessary time transferring information manually.
Not every corrosion finding represents the same level of risk. Maintenance teams need a way to distinguish routine observations from conditions requiring urgent intervention.
As inspection programs grow, spreadsheets can create problems with version control, duplicate records, missing updates, and inconsistent calculations.
Therefore, the goal should not simply be to collect more inspection data.
The goal should be to convert inspection data into decisions.
A practical corrosion management workflow should connect inspection findings with asset condition, risk, maintenance priorities, and follow-up actions.
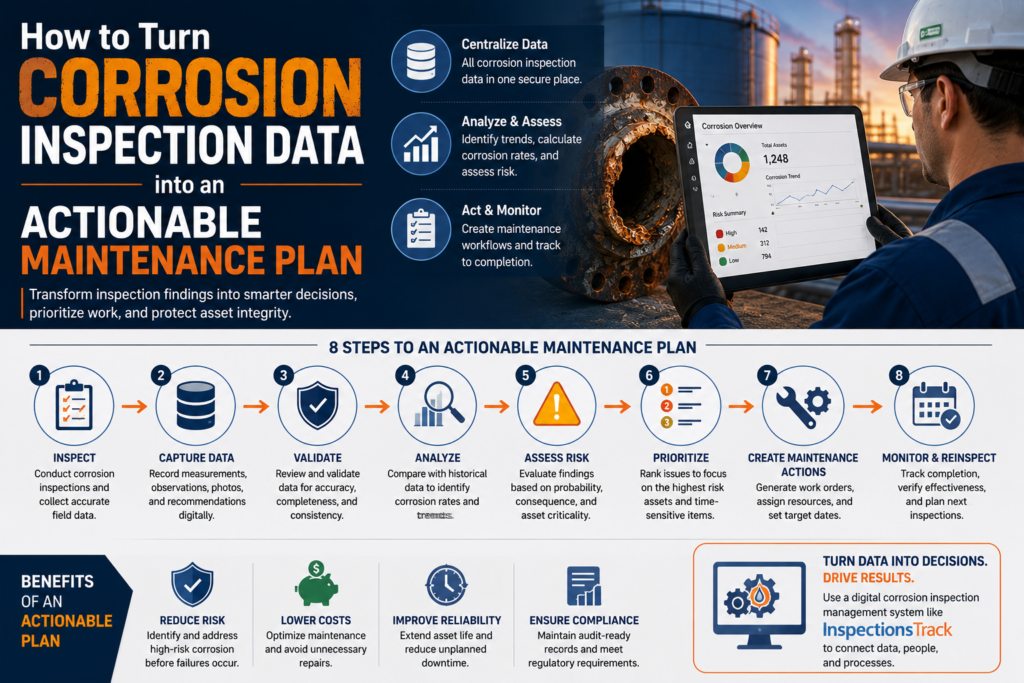
A typical process looks like this:
Inspect → Capture Data → Validate → Analyze → Assess Risk → Prioritize → Create Maintenance Actions → Monitor → Reinspect
Let’s look at each stage.
The first step is creating a reliable digital record of inspection results.
Instead of relying exclusively on paper forms or disconnected spreadsheets, inspection teams can use digital inspection forms to capture information directly in the field.
A digital corrosion inspection workflow can capture:
This reduces manual data entry and creates a structured dataset that can be analyzed later.
A PDF report is useful for communication, but structured inspection data is much more valuable for analysis.
For example, instead of simply storing:
“Corrosion observed on pipe section.”
A structured system can record:
| Data Point | Example |
|---|---|
| Asset | Process Pipeline P-104 |
| Inspection Type | UT Thickness Inspection |
| Location | 12 o’clock position |
| Previous Thickness | 12.4 mm |
| Current Thickness | 11.1 mm |
| Corrosion Rate | 0.65 mm/year |
| Minimum Required Thickness | 9.0 mm |
| Condition | Wall thinning |
| Recommendation | Monitor and assess |
| Next Action | Detailed inspection |
| Priority | High |
This makes the information much easier to use for maintenance planning.
A single inspection provides a snapshot.
Multiple inspections provide a trend.
This distinction is particularly important when managing corrosion.
For example, imagine that an asset has the following recorded wall thickness:
| Inspection Year | Wall Thickness |
|---|---|
| 2022 | 14.0 mm |
| 2023 | 13.2 mm |
| 2024 | 12.5 mm |
| 2025 | 11.7 mm |
| 2026 | 10.9 mm |
The latest measurement tells you the current condition.
However, the historical trend indicates that the asset is experiencing continuous wall loss.
That information can help engineers determine whether the asset requires:
Therefore, historical inspection data should not be treated as old information. It is an important part of predicting future asset condition.
Corrosion rate is one of the most important indicators when analyzing thickness inspection data.
A simplified corrosion rate calculation can be represented as:
Corrosion Rate = (Previous Thickness − Current Thickness) ÷ Time Between Inspections
For example:
Previous thickness = 12.5 mm
Current thickness = 11.5 mm
Inspection interval = 2 years
Corrosion rate:
(12.5 − 11.5) ÷ 2 = 0.5 mm/year
However, real-world corrosion assessment can involve additional considerations, including measurement uncertainty, localized corrosion, inspection methodology, operating conditions, and engineering requirements.
Therefore, automated calculations should support engineering decisions rather than replace engineering judgment.
Once corrosion trends are available, inspection teams can begin estimating remaining asset life.
A simplified approach can consider:
Remaining Life ≈ (Current Thickness − Minimum Required Thickness) ÷ Corrosion Rate
For example:
Current thickness = 11.5 mm
Minimum required thickness = 9.0 mm
Corrosion rate = 0.5 mm/year
Estimated remaining life:
(11.5 − 9.0) ÷ 0.5 = 5 years
This type of calculation can help maintenance and integrity teams identify assets that require closer attention.
However, remaining-life calculations should always be interpreted within the appropriate engineering, regulatory, and operational context.
Not every corrosion finding should receive the same maintenance priority.
A small, stable indication on a low-consequence asset may require routine monitoring.
Meanwhile, significant wall loss on critical process equipment may require immediate engineering review.
A risk-based approach can consider factors such as:
A simple prioritization model might look like this:
| Priority | Typical Condition | Recommended Action |
|---|---|---|
| Critical | Severe degradation or immediate integrity concern | Immediate assessment/intervention |
| High | Rapid degradation or limited remaining margin | Schedule corrective action quickly |
| Medium | Moderate degradation | Planned maintenance and monitoring |
| Low | Stable or minor condition | Routine monitoring |
The exact criteria should be defined by the organization’s integrity management procedures and engineering requirements.
An inspection recommendation should not become the end of the process.
Instead, it should trigger a clearly defined action.
For example:
Inspection Finding: Significant corrosion detected on storage tank shell.
Recommendation: Engineering assessment and repair planning.
Maintenance Action: Create corrective maintenance task.
Responsible Team: Maintenance / Asset Integrity.
Priority: High.
Target Date: Defined according to risk and company procedures.
Follow-Up: Verify repair and perform post-maintenance inspection.
This creates a clear connection between inspection → recommendation → maintenance → verification.
One of the biggest weaknesses in manual inspection workflows is losing visibility after an inspection report has been issued.
A finding might be documented, but who is responsible for resolving it?
Has the work been scheduled?
Has the repair been completed?
Was the corrective action verified?
Does the asset require another inspection?
A digital inspection management platform can provide visibility into these stages.
For example:
Finding Identified → Action Assigned → Action Scheduled → Action Completed → Verification → Closed
This creates accountability while reducing the chance that important findings remain unresolved.
Corrosion inspection data should also influence future inspection programs.
For example, if an asset repeatedly shows accelerated corrosion, the inspection interval may need to be reviewed.
Similarly, assets with stable condition over multiple inspection cycles may require a different monitoring strategy.
Therefore, inspection history can support decisions about:
This creates a continuous improvement cycle.
A good maintenance plan should contain enough information for the responsible team to understand what needs to happen and why.
At a minimum, it should identify:
This information turns an inspection report into a practical maintenance workflow.
For oil and gas organizations, managing corrosion inspection data through spreadsheets alone can become difficult as asset portfolios and inspection programs grow.
This is where dedicated oil and gas inspection software can provide significant value.
InspectionsTrack is designed to help inspection teams digitize inspection workflows, manage asset information, capture field data, generate reports, and maintain visibility across inspection activities.
With InspectionsTrack, organizations can manage inspection information through a centralized digital platform rather than relying entirely on disconnected spreadsheets and documents.
InspectionsTrack can support inspection teams with capabilities such as:
For teams conducting multiple inspection types, having inspection information within a connected system can make it easier to move from data collection to action.
Corrosion does not happen in isolation.
Every inspection finding belongs to an asset, component, location, or system.
Therefore, corrosion inspection data should be connected with asset information.
For example:
Facility → System → Equipment → Component → Inspection → Finding → Recommendation → Maintenance Action
This structure makes it easier for inspection and integrity teams to understand the context of individual findings.
It also makes historical data more useful because teams can review the inspection history associated with a specific asset.
Traditional inspection reporting often focuses on producing a final document.
However, modern inspection management should go further.
The objective should be to create actionable inspection intelligence.
For example:
Inspector completes inspection → PDF generated → Report emailed → Maintenance reviews report → Action manually created.
Inspector completes inspection → Data captured digitally → Findings identified → Priority assigned → Recommendation recorded → Maintenance action tracked → Completion verified → Inspection history updated.
The second approach creates a continuous information loop.
As a result, inspection data becomes more useful for both short-term maintenance and long-term asset integrity decisions.
A structured corrosion management workflow can provide several operational benefits.
Teams can focus resources on assets and findings that require the most attention.
Historical inspection information can provide a clearer picture of asset condition.
Maintenance teams spend less time searching through reports and spreadsheets.
Organizations can maintain a clear record of findings, recommendations, actions, and verification.
Digital forms, automated reports, and structured data can reduce repetitive manual processes.
Historical trends can help teams plan future inspection activities more effectively.
Centralized inspection records make it easier to retrieve supporting documentation when required.
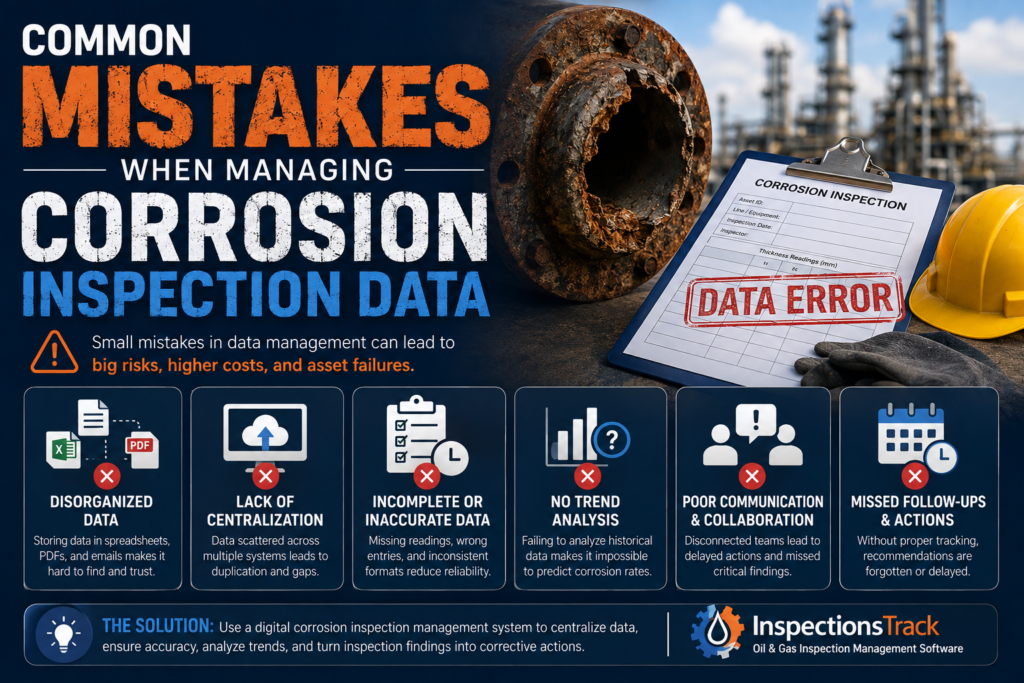
Even organizations with established inspection programs can encounter data management problems.
A report should communicate findings, but the process should continue into maintenance and follow-up.
Spreadsheets can be useful for analysis, but they become harder to control as the number of assets and inspections increases.
A current thickness measurement without historical context may not reveal how quickly an asset is degrading.
Every significant recommendation should have a clear responsible person or team.
Identifying a defect is only useful if the organization can ensure that the required action is completed.
Standardized digital forms and checklists can help improve data consistency across inspectors and locations.
Oil and gas companies looking to improve their corrosion inspection management can follow a structured approach.
Define the information that inspectors need to capture for each asset and inspection type.
Use mobile inspection forms to reduce paper-based data collection and manual transcription.
Connect inspection results to the relevant equipment, components, and locations.
Maintain previous inspection results so teams can identify trends.
Use asset criticality and inspection findings to determine which actions require attention first.
Create maintenance or corrective actions directly from inspection recommendations where appropriate.
Track actions until they are completed and verified.
Feed inspection history back into the inspection planning process.
This creates a continuous asset integrity management cycle.
One of the biggest opportunities from structured inspection data is moving away from purely reactive maintenance.
Reactive maintenance asks:
“What failed?”
A proactive inspection program asks:
“What is degrading?”
A predictive approach goes one step further:
“What is likely to happen if the current degradation trend continues?”
By combining historical inspection results, corrosion rates, asset criticality, and maintenance history, organizations can make more informed decisions about future asset condition.
However, predictive maintenance depends heavily on the quality and consistency of the underlying inspection data.
In other words:
Better inspection data → Better analysis → Better maintenance decisions → Better asset integrity outcomes
Read more : Improving Asset Life Predictions with Better Inspection Data
The purpose of corrosion inspection is to identify, assess, and monitor degradation that could affect the integrity, reliability, safety, or serviceability of equipment and infrastructure.
Corrosion inspection data helps maintenance and integrity teams understand asset condition, identify degradation trends, prioritize risks, and determine appropriate corrective or preventive actions.
Important information can include thickness measurements, corrosion rates, defect locations, photographs, inspection dates, asset details, previous readings, recommendations, and corrective actions.
Inspection software can centralize asset and inspection information, standardize data collection, automate reporting, track findings, and improve visibility into corrective actions and inspection history.
Inspection data consists of measurements, observations, photographs, and other collected information. Actionable inspection intelligence adds analysis, prioritization, recommendations, ownership, and follow-up actions so the information can support real maintenance decisions.
Corrosion inspection is not simply about finding defects.
The real objective is to understand what the inspection findings mean, what should happen next, and how those actions will protect the asset.
When inspection data remains inside disconnected reports and spreadsheets, organizations can struggle to turn valuable information into timely decisions.
However, when corrosion measurements, inspection history, asset information, risk indicators, recommendations, and maintenance actions are connected, inspection data becomes a powerful asset management resource.
For oil and gas inspection teams, a digital inspection management platform such as InspectionsTrack can help create this connection by bringing inspection workflows, asset information, reporting, and maintenance-related activities into a more structured digital environment.
Ultimately, the goal is simple:
Don’t just collect corrosion inspection data. Turn it into decisions, actions, and measurable improvements in asset integrity.
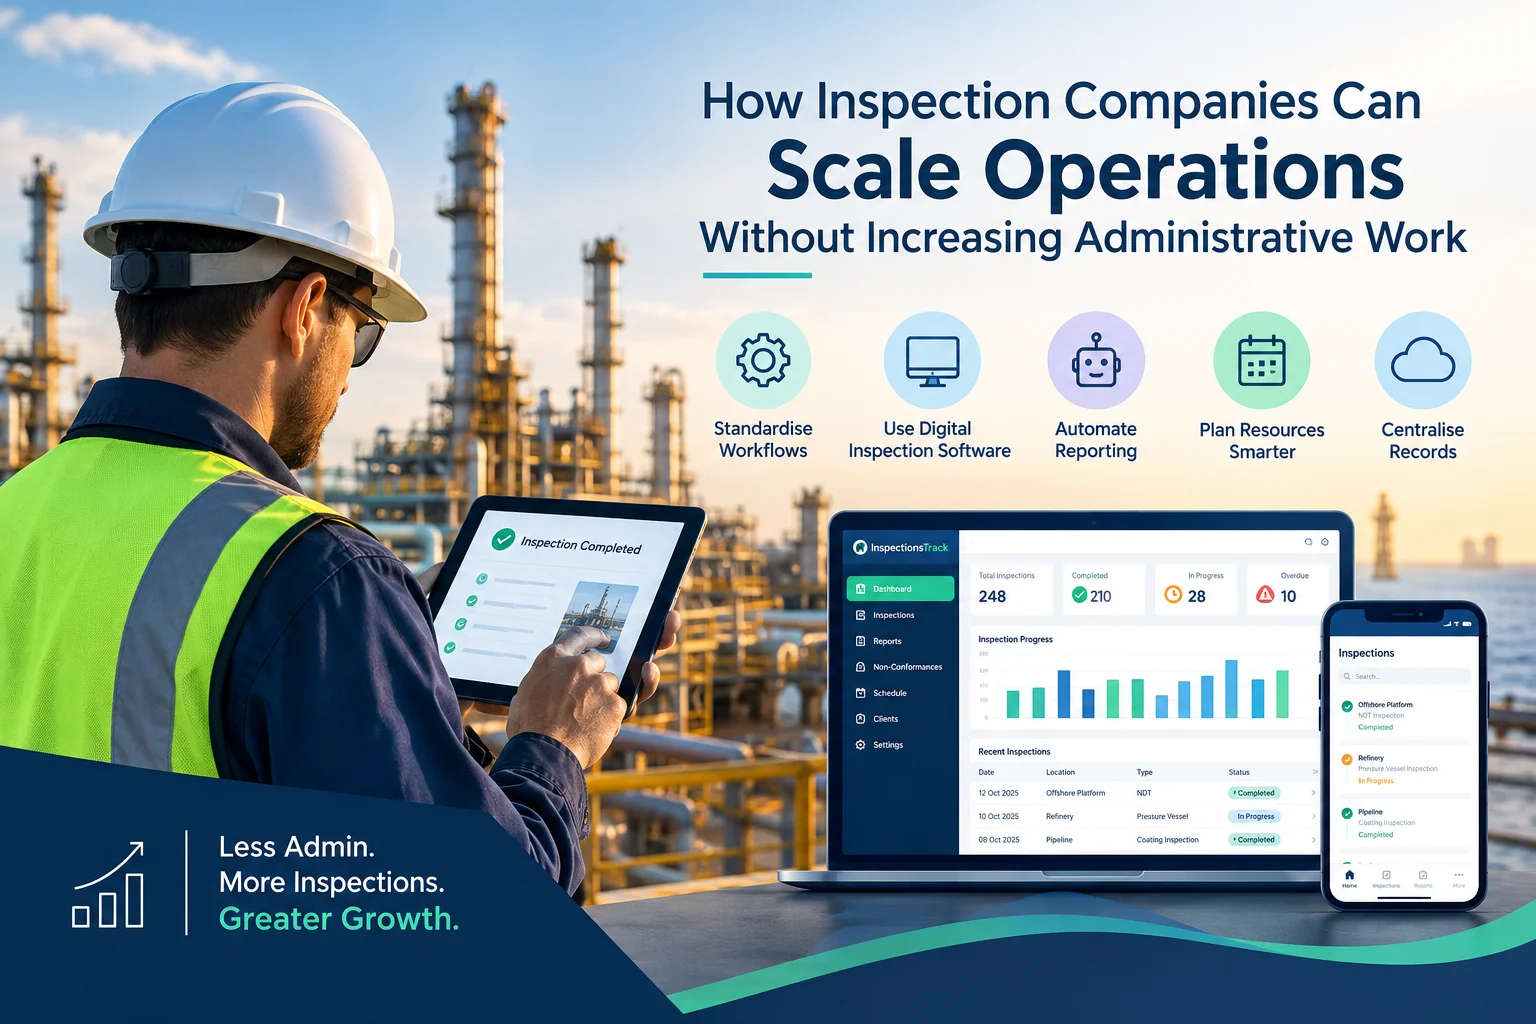
Inspection companies in the oil and gas industry face a common challenge: how to handle more inspections, manage larger projects, and meet client deadlines without increasing administrative workload. As businesses grow, inspection teams must manage…

Meeting client Service Level Agreements (SLAs) is essential for inspection companies working in demanding industries such as oil and gas, energy, and industrial maintenance. Clients expect inspections to be completed on time, reports to be…


Comment (1)
Offshore Inspection Reporting: Eliminate Bottlenecks - inspectionstrack
Aug 13, 2026[…] Read more : Turning Corrosion Inspection Data into Actionable Maintenance Plans […]
Comments are closed.