

Inspection service companies need more than completed inspection reports to measure team productivity. They must also track inspection quality, job completion time, equipment utilization, safety compliance, and client satisfaction.
However, when inspection data is scattered across spreadsheets, emails, and paper-based reports, it becomes difficult to understand how well a team is performing. Therefore, tracking the right Key Performance Indicators (KPIs) helps inspection managers identify delays, improve resource allocation, and deliver more reliable services.
In this guide, we’ll explore 10 important inspection team productivity KPIs, how to measure them, and how inspection management software can help companies improve operational performance.
Measuring inspection productivity helps companies understand whether their teams are completing jobs efficiently without compromising safety or quality.
For example, an inspection team may complete 20 jobs in a week, but that number alone does not reveal whether reports were submitted on time, inspections required rework, or technicians spent too much time travelling between sites.
By tracking performance metrics, inspection companies can:
Most importantly, managers can use these insights to improve processes rather than simply expecting employees to work faster.
The following inspection performance indicators provide a balanced view of productivity, quality, efficiency, and service delivery.
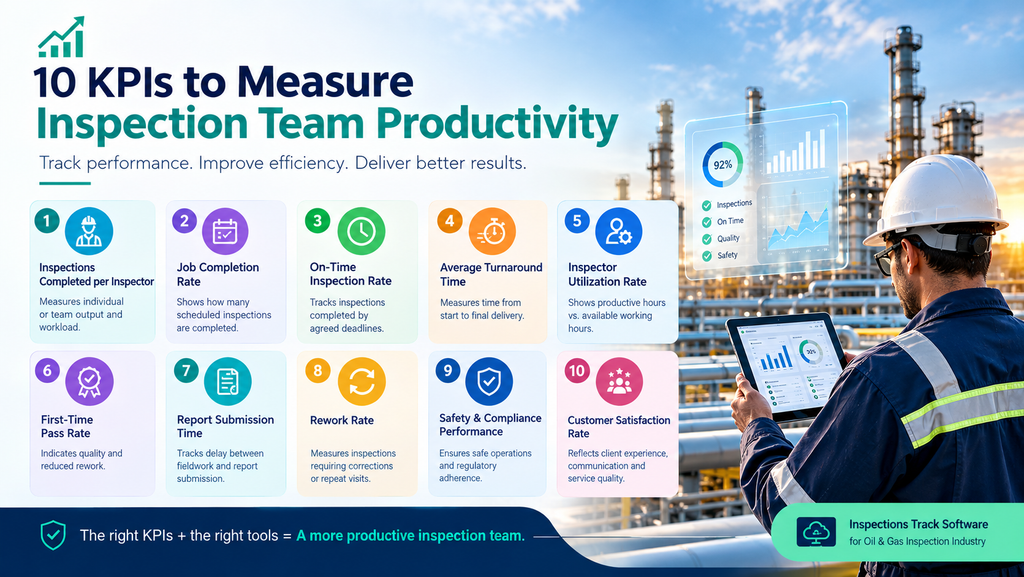
This KPI measures the number of inspections completed by each inspector during a specific period.
Formula:
Inspections Completed per Inspector = Total Completed Inspections ÷ Number of Inspectors
For example, if a team of five inspectors completes 100 inspections in one week, the average is 20 inspections per inspector.
However, inspection complexity matters. A routine equipment check may take less time than a detailed oil and gas inspection. Therefore, compare similar job types and account for site conditions before evaluating individual performance.
The job completion rate shows how many scheduled inspections were completed within the reporting period.
Formula:
Job Completion Rate = (Completed Scheduled Inspections ÷ Total Scheduled Inspections) × 100
For example, if a company schedules 120 inspections and completes 108, its completion rate is 90%.
A low completion rate may indicate poor scheduling, staff shortages, equipment availability issues, or unexpected site delays. Consequently, managers should investigate the reasons behind incomplete jobs instead of focusing only on the final percentage.
Completing inspections is important, but completing them on schedule is equally valuable. This KPI measures the percentage of inspections finished by their agreed deadlines.
Formula:
On-Time Inspection Rate = (Inspections Completed on Time ÷ Total Inspections Due) × 100
For example, if 85 out of 100 inspections due during a month are completed on time, the on-time inspection rate is 85%.
To improve this metric, inspection companies can optimize scheduling, assign available technicians more effectively, and send reminders before deadlines.
Inspection turnaround time measures how long it takes to complete an inspection process, from the agreed starting point to the required deliverable.
Depending on the service, this may include site inspection, data review, report preparation, and final submission.
Formula:
Average Turnaround Time = Total Time Taken for Completed Jobs ÷ Number of Completed Jobs
For instance, if 40 inspections take a combined 200 hours from start to delivery, the average turnaround time is five hours per job.
However, companies should define their start and end points consistently. Tracking fieldwork time separately from report preparation time also helps identify where delays occur.
Inspector utilization measures the proportion of an inspector’s available working time spent on productive, planned inspection activities.
Formula:
Inspector Utilization Rate = (Productive Inspection Hours ÷ Available Working Hours) × 100
Suppose an inspector has 40 available working hours and spends 28 hours on inspection activities. Their utilization rate is 70%.
A low rate may indicate excessive travel, administrative tasks, scheduling gaps, or insufficient job allocation. On the other hand, consistently high utilization can lead to fatigue, reduced flexibility, and safety risks.
Therefore, aim for a sustainable workload rather than maximizing utilization at all costs.
This KPI measures the percentage of inspections that meet the required quality standards without needing corrective work because of inspection errors, incomplete checks, or documentation issues.
Formula:
First-Time Pass Rate = (Inspections Accepted Without Rework ÷ Total Inspections Reviewed) × 100
A high pass rate generally indicates consistent procedures, suitable training, and effective quality control.
If the rate drops, managers should review inspection checklists, technician training, equipment calibration, and report review procedures. Note that genuine equipment failures or non-compliant assets should not automatically count as inspector errors.
Inspection reporting is often a major source of operational delays. This KPI measures the time between completing fieldwork and submitting the final inspection report.
Formula:
Average Report Submission Time = Total Time Between Inspection Completion and Report Submission ÷ Number of Reports Submitted
For example, if 30 reports take a combined 60 hours to submit after fieldwork, the average reporting delay is two hours.
Digital reporting tools, standardized templates, automated data capture, and centralized document storage can help reduce unnecessary administrative work.
This metric tracks how frequently inspections must be repeated because of avoidable mistakes, missing information, or incomplete procedures.
Formula:
Rework Rate = (Inspections Requiring Rework ÷ Total Inspections Completed) × 100
For example, if 12 out of 200 inspections require rework, the rework rate is 6%.
A high rate can increase operating costs, delay client deliverables, and reduce team capacity. To address the problem, categorize rework reasons and identify recurring issues rather than treating every case the same way.
For oil and gas inspection service companies, productivity must never come at the expense of safety or regulatory compliance.
This KPI can include:
For example, a company can track whether all required pre-inspection safety checks were documented before work began.
Use several complementary safety indicators instead of relying only on incident counts. A low number of reported incidents does not necessarily mean a workplace is safe.
Inspection quality also depends on the client’s experience. This KPI helps companies assess whether they deliver accurate reports, communicate effectively, and meet agreed service expectations.
Useful measures include:
For instance, if a company receives four complaints across 100 completed inspections, its complaint rate is four complaints per 100 inspections.
Review feedback regularly to identify recurring concerns, such as late reports, poor communication, or incomplete documentation.
| KPI | What It Measures | Why It Matters |
|---|---|---|
| Inspections per inspector | Individual or team output | Measures workload and capacity |
| Job completion rate | Completed scheduled jobs | Identifies scheduling gaps |
| On-time inspection rate | Deadline performance | Improves service reliability |
| Turnaround time | Time from start to delivery | Reveals process delays |
| Inspector utilization | Productive hours versus available hours | Supports resource planning |
| First-time pass rate | Quality without avoidable rework | Improves consistency |
| Report submission time | Delay after fieldwork | Speeds up deliverables |
| Rework rate | Jobs requiring avoidable corrections | Controls costs |
| Safety and compliance | Adherence to required procedures | Supports safer operations |
| Customer satisfaction | Client experience and service quality | Encourages retention |
Tracking KPIs is only the first step. To achieve measurable improvements, inspection managers must turn performance data into practical action.
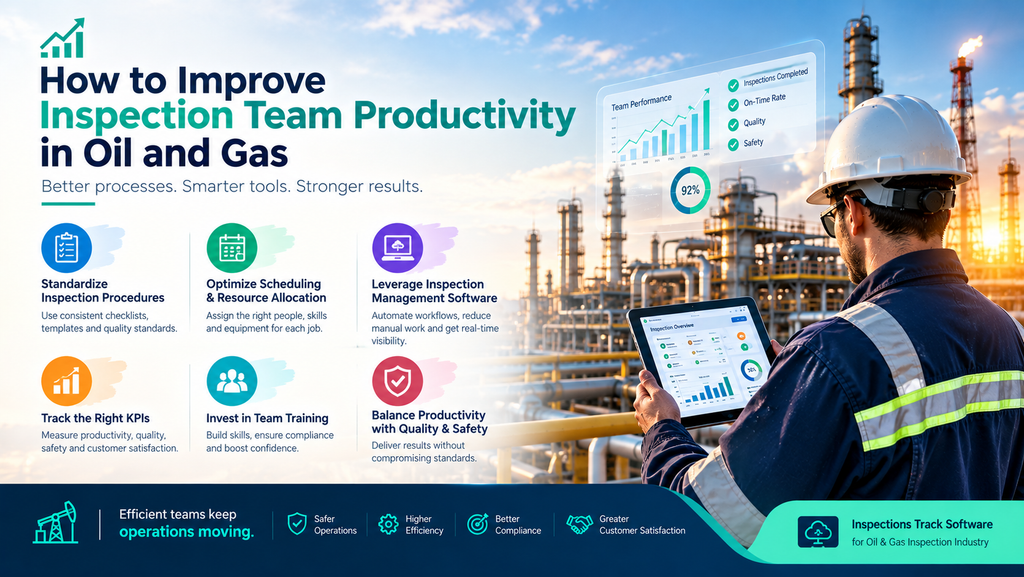
Use consistent checklists, reporting templates, and quality requirements. As a result, inspectors can follow the same process, while managers can compare performance across teams and locations.
Assign inspectors according to their qualifications, availability, location, and job complexity. Additionally, group nearby site visits where practical to reduce unnecessary travel and downtime.
Repeated data entry consumes time that inspectors could spend on fieldwork. Digital forms, reusable templates, and automated workflows can simplify reporting and reduce documentation errors.
Review operational KPIs weekly and examine broader trends monthly. When a metric falls below its target, investigate the cause and assign a clear corrective action.
Avoid rewarding teams solely for completing a high number of inspections. Instead, combine output measures with quality, safety, compliance, and customer satisfaction indicators. This balanced approach encourages sustainable performance.
Oil and gas inspection companies often manage complex workflows involving multiple sites, specialized equipment, inspection schedules, technical documentation, and compliance requirements. When these processes rely on disconnected systems, managers may struggle to obtain an accurate view of team performance.
Inspections Track Software can support oil and gas inspection operations by helping teams organize inspection activities, maintain digital records, and improve visibility into day-to-day work.
Depending on the available features and configuration, inspection management software can help companies:
For inspection service companies, the objective is not simply to digitize paperwork. Instead, it is to make operational information easier to access, review, and use when making decisions.
SkySoft Connections provides software solutions for inspection-related workflows. Companies evaluating Inspections Track Software for the oil and gas inspection industry should assess how its available features align with their reporting requirements, field operations, compliance processes, and productivity measurement needs.
Read more : How to Improve Inspector Utilization Without Overloading Field Teams
There is no single best KPI for every inspection company. However, on-time inspection rate, inspection turnaround time, first-time pass rate, and inspector utilization provide a useful starting point. Together, they measure delivery, efficiency, quality, and resource use.
Operational metrics such as job completion, overdue inspections, and reporting delays can be reviewed weekly. Monthly reviews help managers identify longer-term trends, compare performance, and adjust staffing or processes.
Inspection software can centralize records, standardize workflows, reduce repetitive data entry, and improve visibility into job progress. The actual productivity gains depend on the software’s features, implementation, data quality, and how consistently teams use the system.
Oil and gas inspection companies should prioritize on-time inspections, turnaround time, report submission time, rework rate, inspector utilization, and safety and compliance indicators. The exact mix depends on the services provided and the client’s contractual and regulatory requirements.
Measuring inspection team productivity requires more than counting completed jobs. Inspection service companies should track a balanced set of KPIs covering efficiency, scheduling, reporting, quality, safety, and customer satisfaction.
By reviewing these metrics consistently, managers can identify bottlenecks, allocate resources more effectively, and improve service delivery without compromising inspection standards.
With the right processes and suitable digital tools, including Inspections Track Software for the oil and gas inspection industry, companies can build a clearer picture of operational performance and make better-informed decisions as their inspection workload grows.
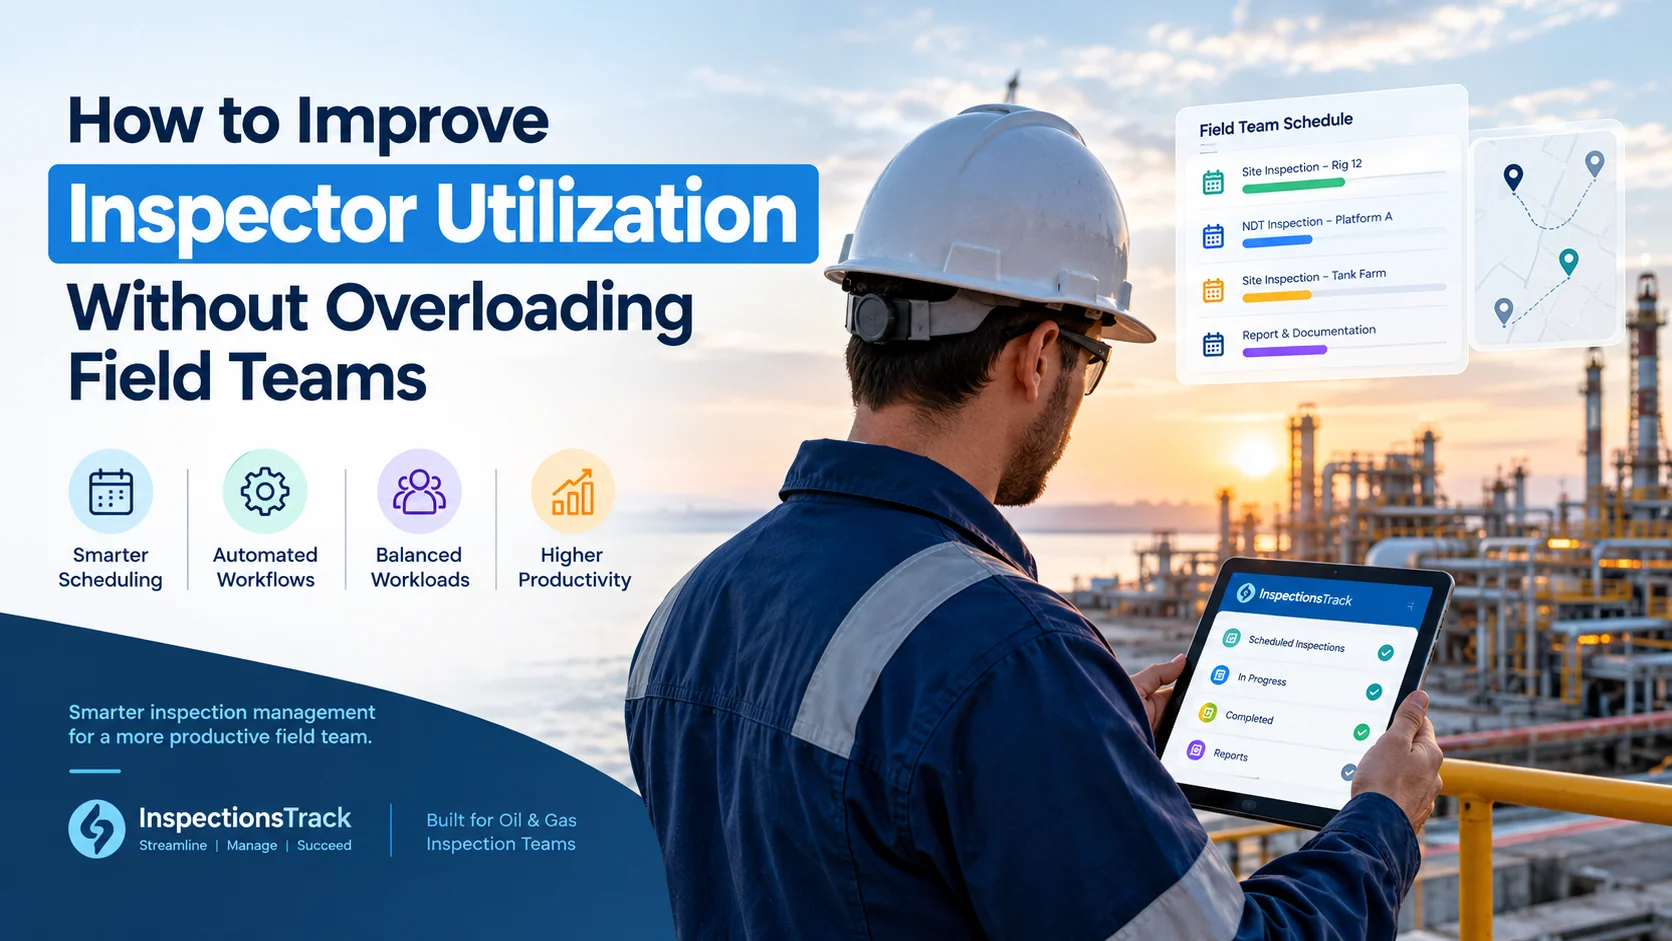
For inspection companies in the oil and gas industry, improving inspector utilization is essential for increasing productivity, controlling operational costs, and meeting client deadlines. However, maximizing the number of inspections completed does not necessarily mean…
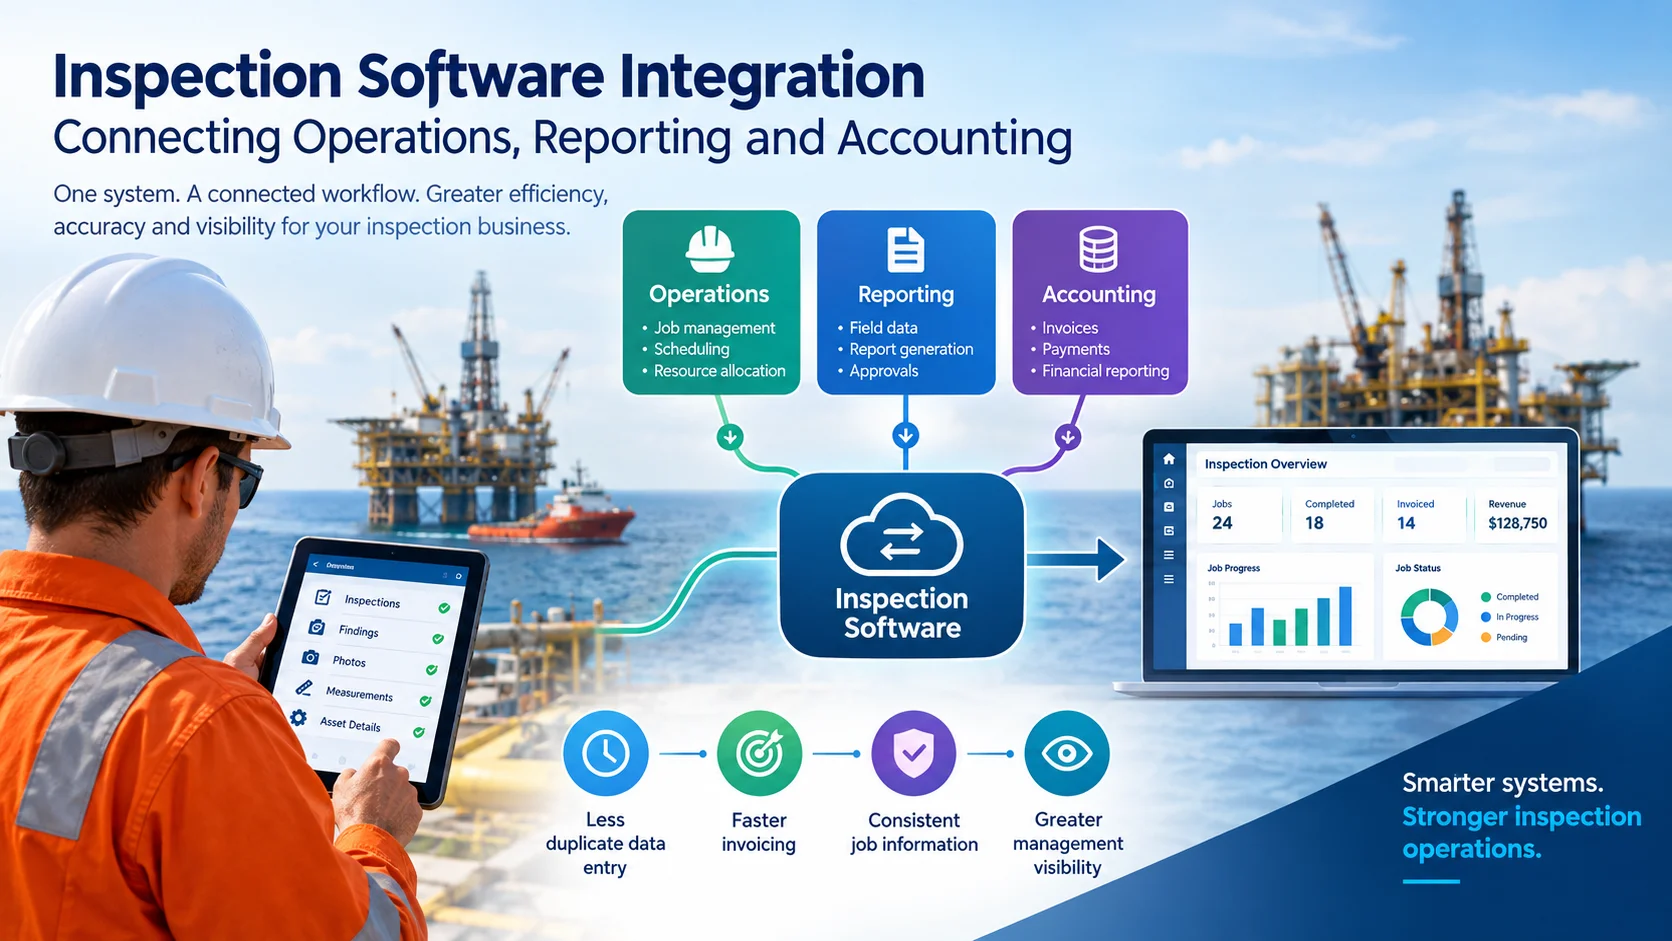
Inspection companies in the oil and gas industry manage much more than inspections. They also coordinate jobs, assign inspectors, track equipment, prepare technical reports, manage client approvals, and process invoices. When these activities run through…


